Dashboard for Quest KACE
The Quest KACE interface provides a comprehensive insight into the IT infrastructure of a company. The challenge, however, is that the information is so extensive and granular that only skilled personnel can gain a deeper understanding of the data, and thus the state of IT, at considerable cost in terms of time.
Critical to IT Success
The dashboard for Quest KACE provides information designed to display key IT performance indicators and relevant business data in a visual and interactive way. IT administrators can use the dashboard to create their own reports, enabling them to gain actionable insights while saving costs and time.
The intersection between IT administration and management
While the Quest KACE System Management Appliance provides an incredibly powerful data pool of information, but it is not presented with the necessary transparency and visuality. This not only prevents IT administration from making important IT decisions early, but also makes it difficult to communicate to management and create the necessary understanding.
Identifying IT trends
The goal of every admin is to promote positive results and reduce the number of negative events. With our dashboard solution, you can easily identify potential issues and address them in a timely manner. Once they are identified, you can use the individual evaluations to make actionable and better decisions.
Efficiency increase
More accurate and timely IT decisions are the backbone of any successful infrastructure and our dashboard solution enables just that - speed and efficiency. With just a few clicks, you can see all your key performance indicators in an interactive dashboard that can be filtered for a more efficient analysis process.
Visualization of relevant IT data
When analyzing tables or lists, there is an increased risk of overlooking valuable information and making mistakes. Visualizing raw data clears the clutter and simplifies understanding. With the Dashboard, you can visualize Quest KACE as data sources in one central interactive interface.
Decision processes
In today's age of IT, there is no room for coincidence or luck. Data is the most powerful source on which all IT decisions are based, and our dashboard is the critical link between IT administrators and IT strategy, providing invaluable information.
Summary of the reports and evaluations
- Installed operating system base for end devices and servers
- End of Life / Out of Support Overview of all end devices regarding the installed operating system base
- Windows 11 compatibility check
- Windows 10 version overview
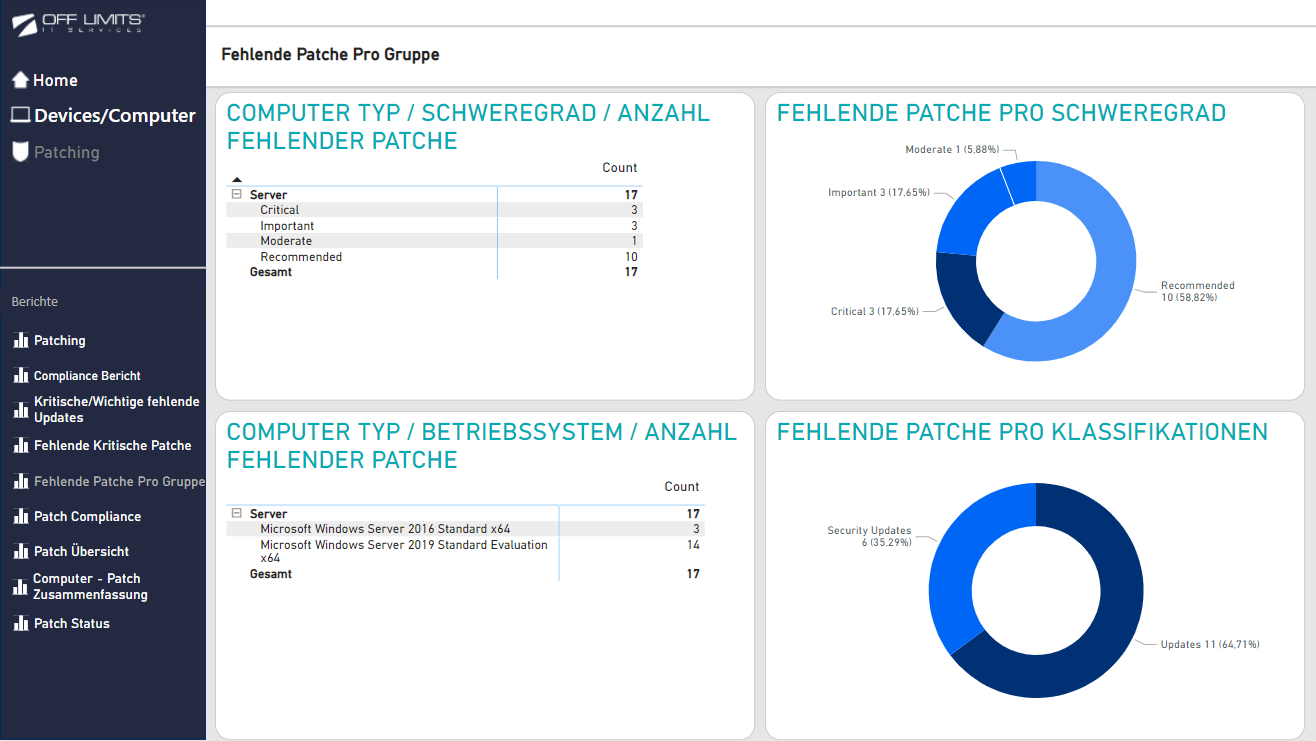
- Group view for patch compliance for test group and production group
- Compliance reporting for patches per operating system, version
- Reporting on criticality and severity in terms of missing patches
- Central overview patch compliance
- and more ...